Watching HF band activities using Grafana
Date: August 18, 2022
The best tool around for watching and analyzing band activites is wspr.live.
It allows ham radio operators to watch all WSPR activities in their local grid locator in TX and RX direction.
For the locator JN to average and median distance looks like:
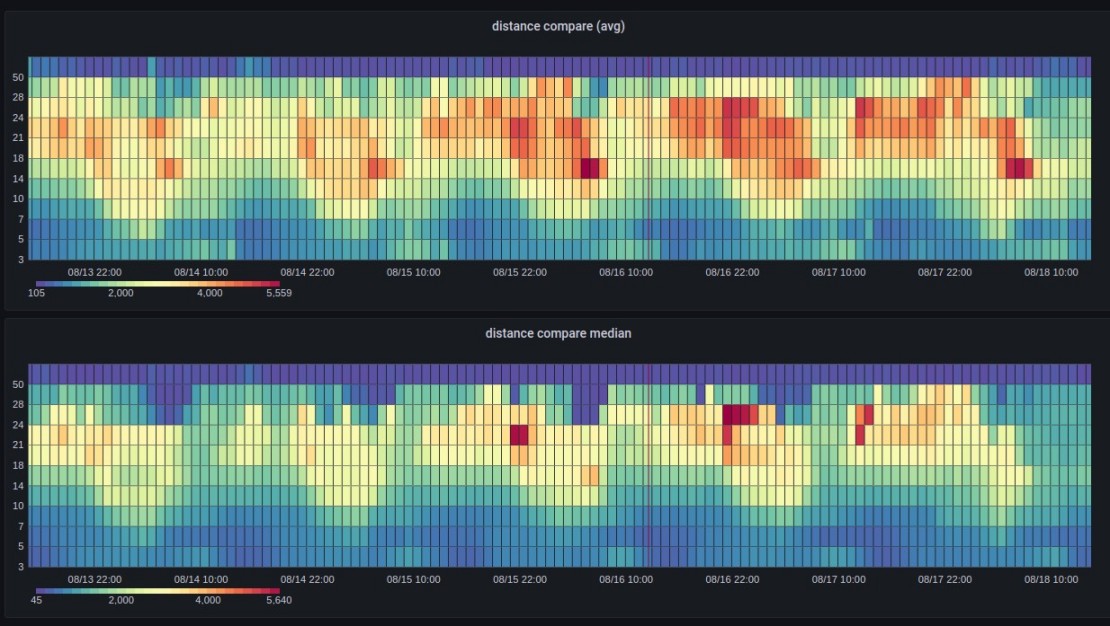
Just by staring at this picture a lot of leassons can be learnt:
- Most likely the “big openings” will be in the afternoon. Especially on the higher bands like 15m and even 10m.
- All bands above 50MHz need more WSPR receivers to get reliable propagation statistics
By staring at the “pure” WSPR reception reports and their latest a beautiful early warning system can be established.

MIf you see distances over 10000km you immediately know that Australia is in the boat.
Distances around 6000km are an indicator for the eastcoast of the US.